IQ Score Ranges: Levels, Percentiles and What Each Band Means

Most modern IQ tests set the average at 100 with a standard deviation of 15, so the main ranges run in 15-point steps: roughly 85 to 115 is the average band, 115 to 130 is above average, and 130 and higher places a person in about the top 2% of the population. Below 70 is the range professionals treat as significantly below average. The labels attached to each band (“high average,” “superior,” “gifted,” “genius”) vary by publisher, so the number matters less than the percentile behind it. This guide gives the full chart, the math that produces it, and the limits you should know before reading a score.
TL;DR
- On the common deviation scale (mean 100, SD 15), about 68% of people score between 85 and 115, and about 95% score between 70 and 130.
- A score of 130 is about the 98th percentile. It is the usual threshold for “very superior,” “highly gifted” and Mensa-level labels, though exact cutoffs differ by test.
- “Genius” is not a clinical category. Popular charts place it at 140 or 145 and above, but no standard body defines it.
- Score labels are descriptive conventions, not diagnoses, and an unproctored online result is an estimate with a margin of error.
Table of Contents
- The IQ Score Ranges Chart
- Why the Ranges Are 15 Points Wide
- The Average Range: 90 to 109
- High Average and Superior: 110 to 129
- Is 130 a Good IQ? Meaning and Percentile
- What Is a High IQ?
- What IQ Is Genius?
- The Lower Ranges: Below 90
- Our Perspective: Read the Range, Not the Digit
- How to Read Your Own Score
- Take the Assessment and See Your Range
- FAQ
- Sources
The IQ Score Ranges Chart
The chart below uses the deviation IQ scale, where the mean is set to 100 and one standard deviation is typically 15 points. Percentiles are calculated from the normal distribution and rounded. Labels follow the common Wechsler-style wording, which we use as a reference point rather than a universal standard.
| IQ range | Typical label | Approximate percentile at the band’s lower edge | Share of population in band (approx.) |
|---|---|---|---|
| 130 and above | Very superior / highly gifted | 98th | 2.3% |
| 120 to 129 | Superior | 91st | 6.9% |
| 110 to 119 | High average | 75th | 16.1% |
| 90 to 109 | Average | 25th | 50% |
| 80 to 89 | Low average | 9th | 16.1% |
| 70 to 79 | Borderline / very low | 2nd | 6.9% |
| Below 70 | Extremely low | Below 2nd | 2.3% |
Two cautions apply immediately. First, classification labels and boundaries vary by test publisher, and psychologists are encouraged to use the terminology of the test actually administered. Second, the shares in the table assume a perfectly normal distribution, which real test norms only approximate, particularly at the extremes.
Why the Ranges Are 15 Points Wide
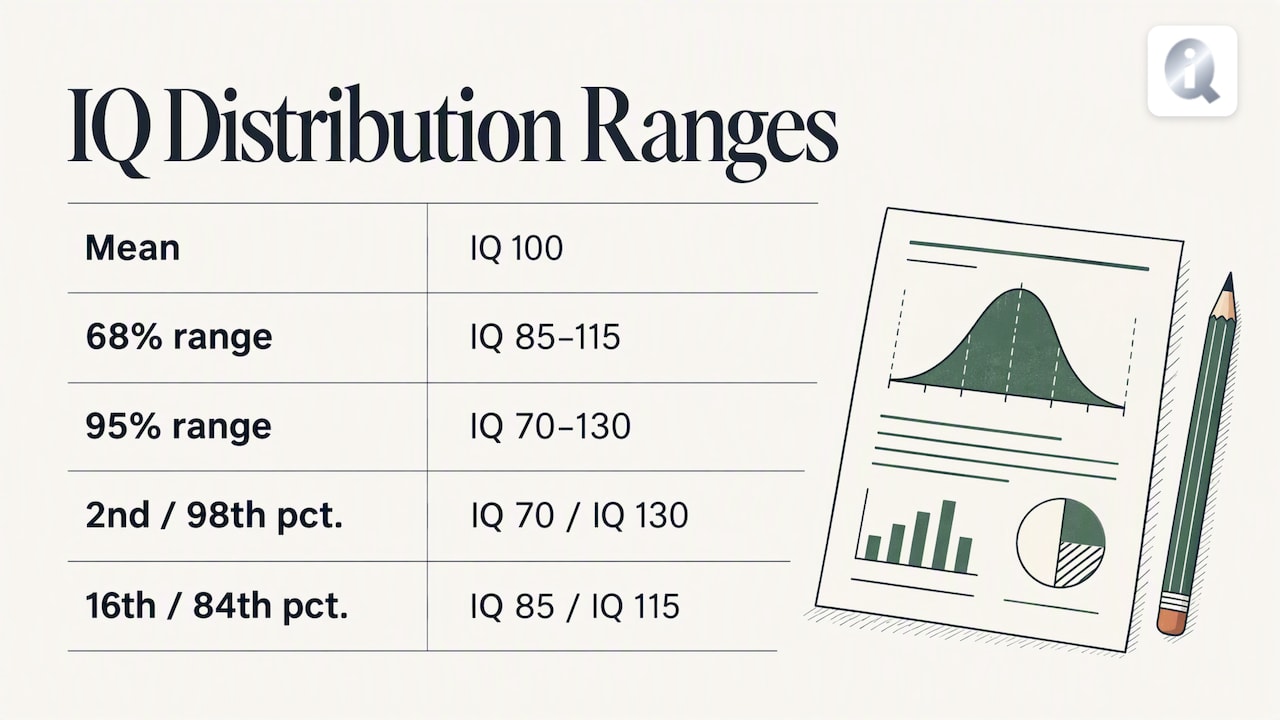
IQ scores are not raw counts of correct answers. Raw results are compared with a norming sample of people in the same age group, then converted so that the middle of the distribution sits at 100. Under that conversion, about 68% of the population falls within one standard deviation of the mean (85 to 115), and about 95% falls within two (70 to 130).
This is why the bands are symmetrical. If 130 is the 98th percentile, 70 is the 2nd. If 115 is the 84th, 85 is the 16th. The chart is one bell curve cut at regular intervals.
The scale is not universal. Some older tests used a standard deviation of 16 or 24, and the Mensa guidance on testing notes that a result of 132 on one test can equal 148 on another. That is the reason percentile is the more portable figure: a 98th-percentile result means the same thing regardless of the scale used to report it. If you hold a score from a different scale, our IQ score converter translates it, and the IQ percentile calculator turns any score into a rank.
The Average Range: 90 to 109
Half of all people land between 90 and 109. Clinical reports commonly call this “average,” and many practitioners treat 85 to 115 as the broader normal range because it spans one standard deviation either side of the mean.
A few practical points follow:
- A score of 100 is by construction the 50th percentile, not a pass mark.
- The difference between 95 and 105 is small relative to the test’s own measurement error.
- Population averages for a country or group are not the same thing as the scale’s fixed mean. We explain that distinction in US average IQ: why 100 is a norm, not a national score.
High Average and Superior: 110 to 129
Scores from 110 to 119 are usually labeled high average, covering roughly the 75th to 90th percentiles. At 120 and above the label commonly becomes superior. The APA Dictionary describes superior intelligence as an arbitrary category attained by about 15% of the population, starting around an IQ of 120 on the Wechsler and Stanford-Binet scales. The 15% figure is a rounded one; the strict normal-curve share above 120 is closer to 9%, which shows how loosely these categories are drawn.
If you are asking whether 120 is “good,” the answer is that it is higher than roughly nine in ten people in the norming sample. Our guide to what counts as a good IQ score goes through that context in more detail.
Is 130 a Good IQ? Meaning and Percentile
Yes, by any statistical measure. An IQ of 130 sits two standard deviations above the mean, which corresponds to about the 98th percentile: roughly 2 people in 100 score at or above it.
This is the threshold most often attached to three overlapping terms:
- Very superior or extremely high. Wechsler-based scales commonly use these labels for 130 and above, though other publishers use different terminology for the same statistical range.
- Highly gifted or gifted. Gifted programs often use a cutoff near 130, but school districts set their own criteria, and many combine IQ with achievement data, teacher input or other measures. The cutoff depends on the district, so check its published policy.
- Mensa eligibility. Mensa requires a score within the upper two percent on an approved, supervised test. It defines the cutoff as the 98th percentile rather than a fixed IQ number.
A 130 does not predict success on its own terms. The APA Dictionary notes that IQ reflects intellectual potential as measured, and scores can be influenced by factors such as education and health. A 130 on one day, on one test, is a data point.
What Is a High IQ?
There is no single official cutoff, but a workable guide follows the chart:
| Description | Approximate IQ | Approximate percentile |
|---|---|---|
| Above average | 110 and above | 75th and above |
| High | 120 and above | 91st and above |
| Very high / gifted range | 130 and above | 98th and above |
| Exceptionally high | 145 and above | 99.9th and above |
The last row is a calculation from the normal curve: 145 is three standard deviations above the mean, leaving about 1 person in 740 above it. Real score distributions thin out at the extremes, and most standard tests are not built to discriminate reliably there, which is the main reason very high scores should be read with caution.
What IQ Is Genius?
Popular charts, including several that rank for this topic, place “genius” or “near genius” at 140 and above, and many writers prefer 145 or 160. None of these is a scientific standard. Psychology has no formal “genius” category; the word describes exceptional achievement or originality, not a score band.
Three reasons the number is unreliable:
- Scales differ. A 160 on a scale with SD 24 equals about a 140 on the SD 15 scale, so the same label can imply very different rarity.
- Test ceilings. Standard instruments are designed to be most accurate near the middle. Differences between 150 and 160 are within measurement error.
- Achievement is not IQ. The APA research on intelligence and perceived leadership examined non-linear relationships, and the broader point holds: more IQ does not automatically mean more outcome.
If you want to see how a score of 140 or 145 compares statistically, the IQ standard deviation calculator shows the position on the bell curve.
The Lower Ranges: Below 90
Scores of 80 to 89 are labeled low average, and 70 to 79 borderline or very low. Below 70 is the range associated with significant cognitive limitation, but a score alone never establishes a diagnosis. An intellectual disability determination also depends on adaptive functioning and is made by a qualified clinician after a standardized evaluation. If you or your child received a score in this range from a practitioner, the right next step is to discuss the full report with that psychologist, not to rely on a chart.
Our Perspective: Read the Range, Not the Digit
We build and maintain an online IQ assessment, so we see the same misreading every day: a visitor receives a number, compares it with a chart, and treats the label as a verdict. Our view is narrower and, we believe, more useful.
First, a single score is an estimate with error around it. Professional instruments such as the WAIS-5 report a confidence interval around each composite score because no test is perfectly precise. We present results the same way: as a range first, a point second.
Second, the profile carries more information than the composite. Two people with the same overall score can differ sharply: one strong in verbal reasoning and slower in processing speed, the other the reverse. That is why our assessment covers five cognitive domains and reports each. For a worked example of one domain, see our explainer on verbal reasoning IQ.
Third, the test conditions matter. A meta-analysis of 49 studies found that unproctored ability tests produced scores higher by a pooled 0.20 standard deviations than proctored ones. Any online result, ours included, should be read as informational and for personal development, not as clinical diagnosis or formal qualification. If a decision hinges on the number (school placement, a disability evaluation, a Mensa application), a supervised test from a licensed psychologist is the correct route.
— Steve
How to Read Your Own Score
- Find the scale. Confirm the mean and standard deviation the test uses. If it is not 100 and 15, convert it.
- Convert to a percentile. This is the comparable figure. 115 is about the 84th percentile; 130 about the 98th.
- Apply the margin. Treat the score as roughly five points either way. Moving from 118 to 122 between two online attempts is not a meaningful change.
- Look at the domains. Verbal, reasoning, memory, speed and spatial strengths tell you more than the composite.
- Match the label to the source. “Superior” on one report may start at 120 and on another at 125.
Our IQ score meaning tool walks through these steps for any number you enter.
Take the Assessment and See Your Range
Our 50-question IQ assessment can be started without registering and gives an initial result range. The Full IQ Result is a one-off $9.99 and unlocks your exact score, percentile information and the cognitive domain breakdown. The pricing page also lists the one-off $14.99 Personality Full Access and gift options.
FAQ
What is the average IQ range?
The average range is generally 90 to 109, which holds about half the population. A wider “normal” band of 85 to 115 covers about 68%. Both are centered on a mean of 100.
What IQ is considered gifted?
Most definitions start at about 130, the 98th percentile, though some programs use 120 or 125 for broader gifted categories. Districts and organizations set their own thresholds, so ask the program for its criteria. Many also use more than IQ alone.
Is an online IQ score as valid as a clinical one?
No. Clinical tests are proctored, normed and interpreted by trained professionals, while unproctored online tests carry bias and less control. Use an online score as an estimate for curiosity or personal development.
Can my IQ score change?
Yes, within the test’s margin of error, and sometimes more across years or with different test versions. Small differences of a few points are usually measurement noise. Larger shifts deserve a look at test conditions, scale and norms.
Sources
- APA Dictionary of Psychology: IQ
- APA Dictionary of Psychology: superior intelligence
- IQ classification (Wikipedia)
- Mensa International: Getting your IQ tested FAQs
- Pearson: WAIS-5 sample score report
- Meta-analysis of proctored and unproctored ability assessments
- APA PsycNET: intelligence and non-linear performance relations