Is IQ Stable? What Research Shows Across a Lifetime

IQ is relatively stable, but it is not fixed. In adults, a person’s rank among peers stays largely consistent over years, yet any individual score can shift by several points because of measurement error, practice effects and ordinary day-to-day variation. In childhood, scores are far less settled. This article explains what “stable” means in statistical terms, how stability changes with age, what can and cannot move a score, and how to read a result you have in hand.
TL;DR
- Stability is measured as rank-order consistency. A 2024 meta-analysis of 205 longitudinal studies found a mean stability of ρ = .76 at age 20 over a 5-year interval, with general intelligence among the most stable abilities.
- Young children’s scores are the least stable. Stability rises quickly through childhood and is consistently high from late adolescence through late adulthood.
- Rank order is stable, but individual scores still vary. A difference of 10 points between two tests is common enough that it should not be read as a change in intelligence.
- Retest gains, test versions and measurement error explain many apparent changes. Evidence that training raises overall cognitive capacity is limited.
- Treat any single score as an estimate with a margin, and compare results only on the same scale.
Table of Contents
- What “stable” means when researchers talk about IQ
- How stable is IQ? The largest evidence base
- Childhood versus adulthood
- What happens in adulthood and later life
- Can an adult’s IQ change?
- Why two scores can differ without intelligence changing
- A practical way to read your own result
- What stability means for students and educators
- Our perspective
- See your own result in context
- FAQ
- Sources
What “stable” means when researchers talk about IQ
Researchers use the word in at least two different ways, and the distinction resolves most of the confusion about this topic.
Rank-order stability asks whether a person keeps the same position relative to peers of the same age. It is expressed as a test-retest correlation. A correlation of 1.0 would mean everyone keeps exactly the same rank. A correlation of 0 would mean the first test tells you nothing about the second.
Mean-level stability asks whether the average performance of a group rises or falls with age. Raw ability on many reasoning tasks changes across a lifespan even while rank order holds, because IQ scores are age-normed. An IQ of 100 always means “average for your age group,” so a score can stay constant while raw performance changes.
A third idea sits underneath both: score-level consistency for one person. Even when rank order is stable across a population, the exact number a specific person gets can differ from one sitting to the next. This is where most real-world questions land, and it is covered below.
How stable is IQ? The largest evidence base
The strongest single source is a 2024 meta-analysis by Breit, Scherrer, Tucker-Drob and Preckel, which pooled 205 longitudinal studies, 87,408 participants and 1,288 test-retest correlations. Its main findings:
- The mean rank-order stability was ρ = .76 for an age of 20 years and a 5-year test-retest interval.
- Depending on the specific ability, stability ranged from .65 to .80, with the highest stability observed for general intelligence.
- The effect of sample age on stability followed a negative exponential pattern: low in preschool children, rapidly increasing through childhood, and consistently high from late adolescence to late adulthood.
- Stability declined as the gap between tests grew, but that decline flattened out from roughly 5 years onward.
That last point matters. It means the correlation between a score at 25 and a score at 30 is not dramatically different from the correlation between a score at 25 and one at 45. Most of the loss of consistency happens early in the interval, then levels off.
A BPS Research Digest summary of the same paper put the adult figures in plain terms: over about six years, abilities were fairly stable, from 0.65 for the least stable abilities (fluid reasoning and learning efficiency) to 0.8 for general intelligence.
The longest follow-up on record
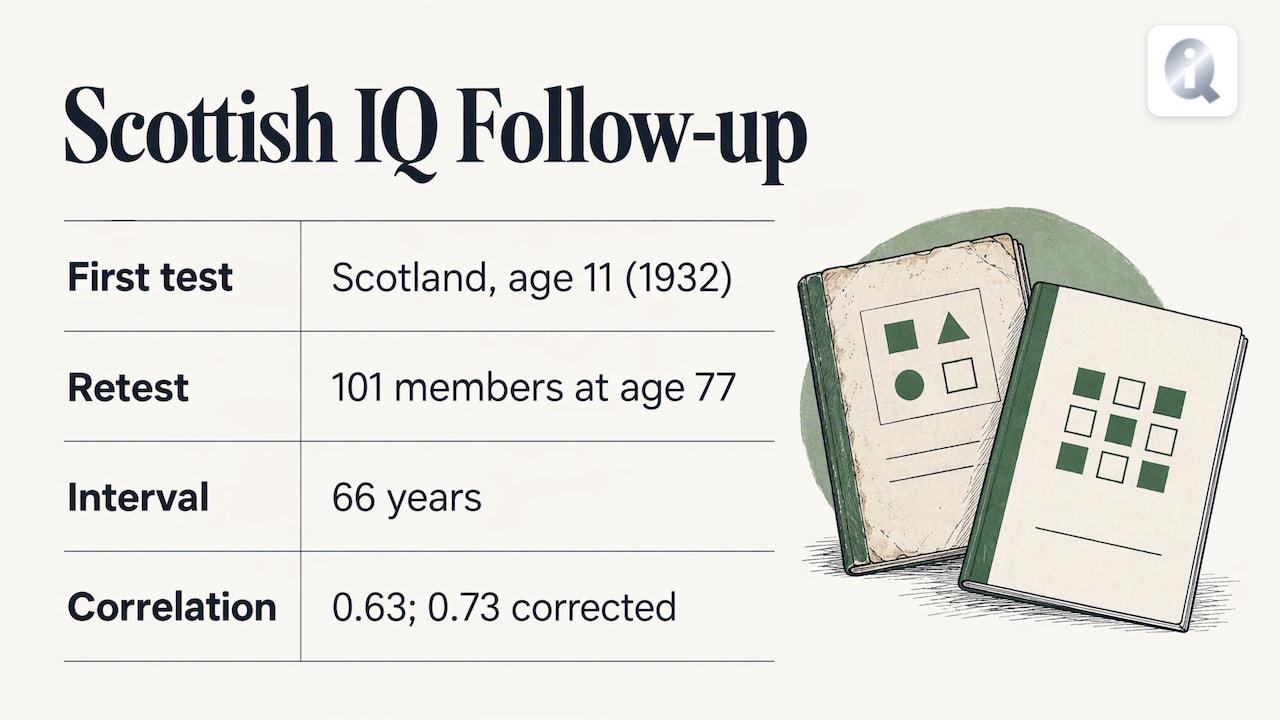
In 1932, nearly every 11-year-old in Scotland took the Moray House Test. A follow-up study by Crawford and colleagues retested 101 members of that group at age 77 with the same test. The correlation was 0.63, or 0.73 once corrected for attenuation (the unreliability of the measures). The authors described it as the longest follow-up of psychometric intelligence reported at the time. A 66-year gap and a still-substantial correlation is a notable result: people who scored relatively high as children tended, as a group, to score relatively high in late life.
Childhood versus adulthood
Stability is not a single number across a life. It depends strongly on when you test.
| Life stage | What the research found | Source |
|---|---|---|
| Under age 4 | Stability did not exceed 0.7, even when tests were less than a year apart | BPS Research Digest, 2024 |
| Around age 8 | Stability of 0.8 was observed only when tests were within two years of each other | BPS Research Digest, 2024 |
| Adulthood | General intelligence stability of about 0.8 over roughly six years | BPS Research Digest, 2024 |
| Age 20, 5-year interval | Mean stability ρ = .76 across abilities | Breit et al., 2024 |
The practical reading is simple. A score from a toddler or preschooler says little about adult intelligence. A score from a teenager says considerably more. A score from an adult is a reasonably good predictor of that adult’s score several years later.
The same meta-analysis offers a useful benchmark for decision-making. A test-retest correlation of .80 is often treated as the minimum for individual-level diagnostic decisions. According to the authors, that level can only be expected over the age of seven and for short intervals in children, while in adults it is obtained for intervals of over five years. In other words, adult scores hold up better than child scores for the purpose of describing an individual.
What happens in adulthood and later life
Stable rank order does not mean flat performance. The Seattle Longitudinal Study analysis by Hertzog and Schaie followed 412 adults aged 22 to 70 at first test, assessed three times at 7-year intervals. All three age groups showed high covariance stability in general intelligence, meaning people kept their relative positions. The mean levels differed by age group:
- Young adults showed increasing levels.
- Middle-aged adults showed stable levels.
- Older adults showed a salient, approximately linear decline, with an inflection point around age 60.
Two patterns are therefore true at once. Within an age cohort, rank order is consistent. Across a lifetime, raw ability on many reasoning tasks rises into early adulthood, plateaus, and then declines in older age. Because IQ scores compare you with people your own age, a person can keep an IQ near the same figure while their raw performance changes.
If you are curious how abilities differ by age, the average IQ by age calculator shows fluid and crystallized curves separately. Fluid reasoning, the ability to solve novel problems, tends to be the less stable component, consistent with the .65 figure above for fluid reasoning and learning efficiency.
Can an adult’s IQ change?
Yes, in small ways, and mostly not through deliberate effort aimed at the score itself. The evidence separates two things that are easy to blur.
Cognitive capacity is the overall resource available to a person. Cognitive efficiency is how well that capacity is used. A 2022 review by Bastian and colleagues in Nature Reviews Psychology concluded that there is relatively little evidence that cognitive training enhances capacity, but substantial evidence for training-induced improvements in efficiency. That fits everyday experience: practice with a type of puzzle makes you faster and more accurate on that type, without necessarily changing the underlying general factor.
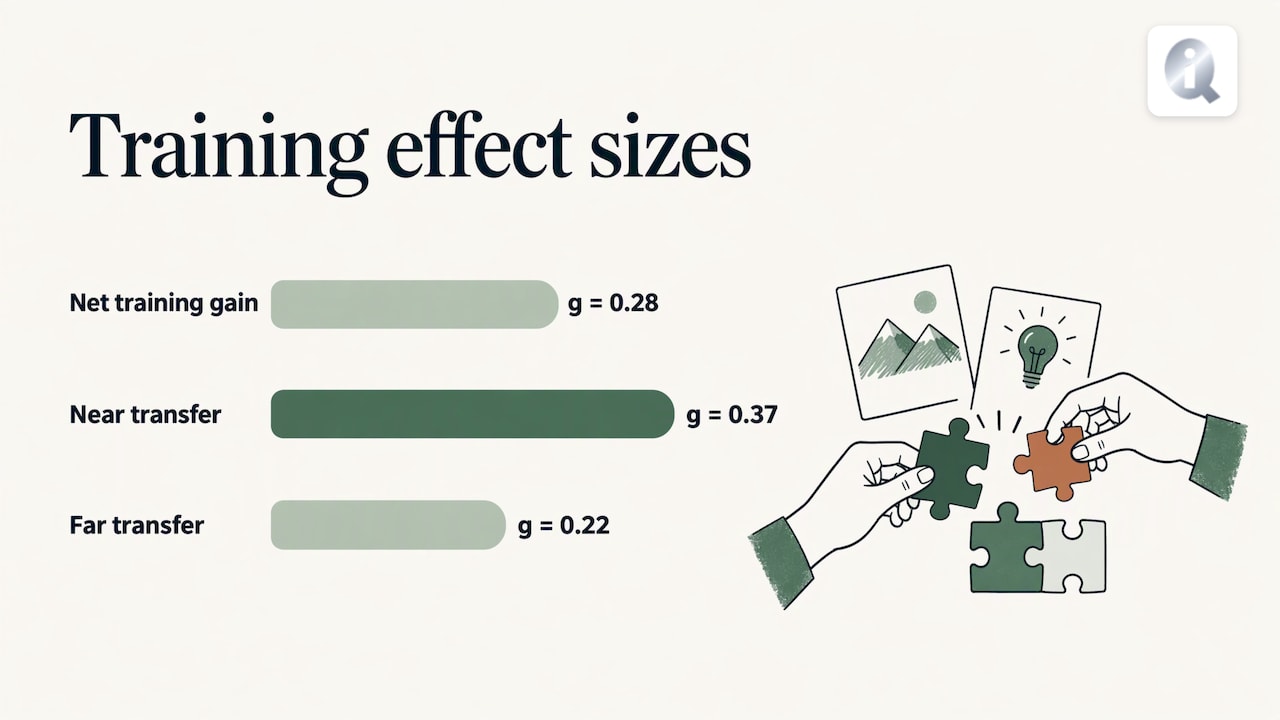
A meta-analysis of 215 training studies in older adults by Basak, Qin and O’Connell found an overall net-gain effect size (g) of 0.28. Near transfer, meaning improvement on tasks similar to the trained ones, was larger (g = 0.37) than far transfer to different tasks (g = 0.22). Only a few training modules produced significant far transfer.
The takeaway is calibrated rather than discouraging. Skills can be trained, and familiarity with test formats helps. A lasting, large shift in general intelligence in a healthy adult is not what the longitudinal data predict.
Why two scores can differ without intelligence changing
Most people who ask whether IQ changes are really asking why their two results differ. Several well-documented factors explain it.
Practice and retest effects
Salthouse and Tucker-Drob (2008) reported that retest gains can average .40 standard deviation units or more and can be detected up to 5 and even 12 years after the initial test. The median short-term change for non-vocabulary variables on successive tests with identical items was .30 SD units, larger than the difference expected from more than 10 years of cross-sectional aging. Taking a similar test twice therefore tends to raise the second score for reasons unrelated to intelligence.
Within-person variability
A 2007 analysis by Salthouse found that estimated within-person variability across three assessments was equivalent in size to the age differences expected across 15 to 25 years. That raises questions about the precision of any single measurement. A 2023 paper by Vaughan and Birney adds that this kind of variation has been replicated in younger populations without cognitive impairment, so it should not be read as decline.
Measurement error
Test-retest correlations cannot exceed what the tests’ reliability allows, so measurement error lowers observed stability. A review by Torres van Grinsven identifies four major sources in pediatric testing: content sampling, time sampling, scoring and administration, and examiner-examinee interaction and situational factors.
The size of the effect in practice is instructive. In a 2013 study of 344 students tested twice at an average interval of 2.84 years, WISC-IV Full Scale IQ test-retest reliability was .82. Even so, 25% of students earned scores that differed by 10 or more points. A high correlation across a group does not guarantee a close match for each person.
Different test versions and norms
The Flynn effect, the long-run rise in raw scores across generations, affects which version of a test you take. A 2014 meta-analysis by Trahan, Stuebing and Fletcher of 285 studies found a mean gain of 2.31 standard score points per decade. The authors note that a test overestimates IQ by about 0.3 points per year between the year it was normed and the year it was administered. Scores from older norms run higher, so two results from different test editions are not directly comparable.
Scales also differ in their standard deviation. A score of 130 on one scale is not 130 on another. Our IQ score converter translates between common scales so that you compare like with like, and the IQ score distribution guide explains how standard deviation and percentiles connect.
Other practical contributors
These are not separate research findings but common-sense conditions that the sources above point toward through situational and time-sampling error: sleep, stress, illness, motivation, distractions, and the format of the test (timed or untimed, supervised or not). Each can nudge a score by a few points without any change in underlying ability.
A practical way to read your own result
- Check the scale. Confirm the mean (usually 100) and standard deviation (usually 15, sometimes 16 or 24). Convert before comparing.
- Think in ranges. Treat a score as a band, not a point. A result of 112 is better described as “somewhere around the low 100s to low 120s” than as exactly 112.
- Favor percentiles. A percentile, such as the 79th, says where you sit relative to peers and is easier to hold in mind than a raw number. The guide to what counts as a good IQ score lays out ranges and percentile context.
- Allow for practice. If you have taken similar puzzles recently, expect the second score to run somewhat higher.
- Retest sparingly. Repeating the same test within weeks mostly measures memory of the items.
- Compare the same type of test. Format shapes results; the overview of IQ test format explains question types and timing.
What stability means for students and educators
Because children’s scores are less stable than adults’, a single childhood score is a snapshot and not a prediction of a lifetime trajectory. In education, that argues for using scores alongside classroom evidence and for reassessing over time. How instruction loads working memory is a related, separate question; this explanation of cognitive load theory for students and educators shows how task design affects performance in ways a score alone does not capture.
Our perspective
We read the stability literature as an argument for careful measurement, not for fatalism. The data show that general intelligence is one of the more stable psychological traits we can measure, and also that every individual score carries a margin of error. Both statements are true, and a useful assessment respects both.
That is why we structure our IQ assessment the way we do. The 50-question test can be completed without an account, and it returns a broad result category first. A broad category is the honest summary when a single sitting is an estimate. Readers who want more can unlock the exact score, percentile context, five-domain breakdown and report. The five-domain view matters because the research shows abilities differ in stability: fluid reasoning and learning efficiency are less stable than general intelligence, so a profile across domains tells you more than one headline number.
We also publish the tools and explanations that let you interpret a result yourself, including score conversion, age curves and distribution calculators. Our view is that a score is most useful when you understand its scale, its percentile and its uncertainty, and when you use it as one input alongside interests, personality and experience in thinking about careers.
Steve
See your own result in context
If you want a current reference point, our 50-question IQ assessment needs no account and gives you a broad result category. You can then choose to unlock your exact IQ, percentile context, five-domain breakdown, personalized report, verifiable certificate and Career Matches for $9.99, paid once per completed result. It is not a subscription. Details are on the pricing page.

If you are more interested in stable traits beyond reasoning ability, the separate Big Five personality assessment gives free OCEAN trait percentiles and a personality archetype after sign-in. Our free IQ tools and calculators cover score conversion, age comparisons and standard deviation.
FAQ
Does IQ change over time?
Rank order is relatively stable, so people tend to stay in a similar position relative to peers. The 2024 meta-analysis found a mean stability of ρ = .76 at age 20 over five years. Individual scores still vary, and raw ability changes with age even when the age-normed IQ stays similar.
Can IQ change in adults?
Small changes are normal, and some are caused by practice, health or test differences rather than real shifts in ability. Training tends to improve efficiency on trained tasks, with limited evidence for gains in overall cognitive capacity. Large, lasting change in healthy adults is not what longitudinal data predict.
At what age does IQ become stable?
Research shows stability rising quickly through childhood and staying consistently high from late adolescence through late adulthood. Scores from children under four are the least stable. Testing after the teen years gives the most consistent picture.
Why did I score differently on two IQ tests?
The most common reasons are measurement error, practice effects, different norms or scales, and day-to-day variation. In one study of students retested after about 2.8 years, a quarter had Full Scale IQ scores that differed by 10 or more points despite a reliability of .82. Convert both scores to the same scale and compare percentiles.
Sources
- The stability of cognitive abilities: A meta-analytic review (Breit et al., 2024)
- Child geniuses may not be ahead forever (BPS Research Digest, 2024)
- Stability of IQ from age 11 to 77 (Crawford et al., 2000)
- Stability and change in adult intelligence (Hertzog and Schaie, 1988)
- Mechanisms underlying training-induced cognitive change (Bastian et al., 2022)
- Differential effects of cognitive training modules in older adults (Basak et al., 2020)
- Implications of short-term retest effects (Salthouse and Tucker-Drob, 2008)
- Implications of within-person variability in cognitive performance (Salthouse, 2007)
- Within-individual variation in cognitive performance (Vaughan and Birney, 2023)
- Sources of measurement error in pediatric intelligence testing
- Long-term stability of the WISC-IV (Watkins and Smith, 2013)
- The Flynn Effect: A meta-analysis (Trahan et al., 2014)