IQ Score Interpretation: What Your Number Means

An IQ score is a norm-referenced standard score: it shows how your performance on a test compares with a representative reference group, on a scale where 100 is the average and one standard deviation is 15 points. A score of 100 means typical performance, 115 is about one standard deviation above the average, and 85 is about one below. Because every score carries a margin of error, the number is best read as a range and as a percentile, not as a fixed trait.
This guide explains how the scale is built, how to convert a score into a percentile, what the common classification labels mean, and which limits matter when you interpret your own result.
TL;DR
- IQ scales are centered on 100 with a standard deviation of 15, so about 68% of people score between 85 and 115 and more than 95% score between 70 and 130 (APA Dictionary of Psychology).
- A score is a rank relative to a norm group. IQ 120 sits near the 91st percentile and IQ 130 near the 98th (HowStuffWorks).
- Classification labels such as “average” or “superior” vary by test and edition, so read the percentile and the confidence interval before the label.
- A single score is an estimate. A band of roughly plus or minus five points is a reasonable way to think about it.
- Index scores (reasoning, memory, speed and others) often tell you more about strengths than the overall number does.
Table of Contents
- What the number measures
- How a raw score becomes an IQ score
- The bell curve: standard deviation and percentiles
- IQ classification ranges
- What specific scores mean
- Margin of error: why a score is a range
- Overall score versus index scores
- What an IQ score cannot tell you
- Interpreting results from online tests
- Our perspective
- See your own score in context
- A short checklist for reading any score
- FAQ
- Sources
What the number measures
The APA defines IQ as a standard measure of intelligence derived from psychological tests. Historically the “quotient” was literal: mental age divided by chronological age, multiplied by 100. A child with a mental age of 10 and a chronological age of 8 would have scored 125 on that formula (APA Dictionary of Psychology).
That ratio method has largely been replaced. Modern U.S. batteries do not divide ages. The publisher compares your raw performance with a representative standardization sample and converts it to a standard score, as described in Nova Southeastern University’s overview of intelligence testing. This is called a deviation IQ: it expresses how far your result lies from the mean of your comparison group.
Two consequences follow:
- The number of correct answers is not your IQ. A raw score of 23 out of 30 has no meaning until it is compared with the norm group for your age.
- IQ is relative, not absolute. It describes your standing among comparable people, not a quantity of intelligence in the way height is a quantity of length.
How a raw score becomes an IQ score
The conversion is a standardization procedure. In its simplest form it has three steps:
- Take your raw score and subtract the norm group’s mean raw score for your age band.
- Divide by the norm group’s standard deviation. The result is a z-score, the number of standard deviations above or below average.
- Convert with the formula IQ = 100 + 15 × z. A discussion of this approach appears on Cross Validated-style Q&A for psychology, which also notes that for children the raw-score distribution has to be estimated for each age group.
Published clinical tests add layers. The Stanford-Binet 5 scoring system converts subtest raw scores into scaled scores with a mean of 10 and a standard deviation of 3, then combines those scaled scores into composite IQ and factor-index scores with a mean of 100 and a standard deviation of 15 (Stanford-Binet 5 scoring guide).
A worked example: suppose the norm mean for your age group is 30 correct answers with a standard deviation of 6. If you answer 39 correctly, your z-score is (39 − 30) ÷ 6 = 1.5, and your IQ is 100 + 15 × 1.5 = 122.5, which would typically be reported as 122 or 123. If you answer 27, z = −0.5 and IQ = 92.5.
The bell curve: standard deviation and percentiles
IQ scores are designed to follow a normal distribution. OpenStax’s psychology text states that the usual scale uses a mean of 100 and a standard deviation of 15, with 85 to 115 being approximately the average range, containing about 68% of scores (OpenStax Psychology 2e). The APA adds that more than 95% of scores fall between 70 and 130.
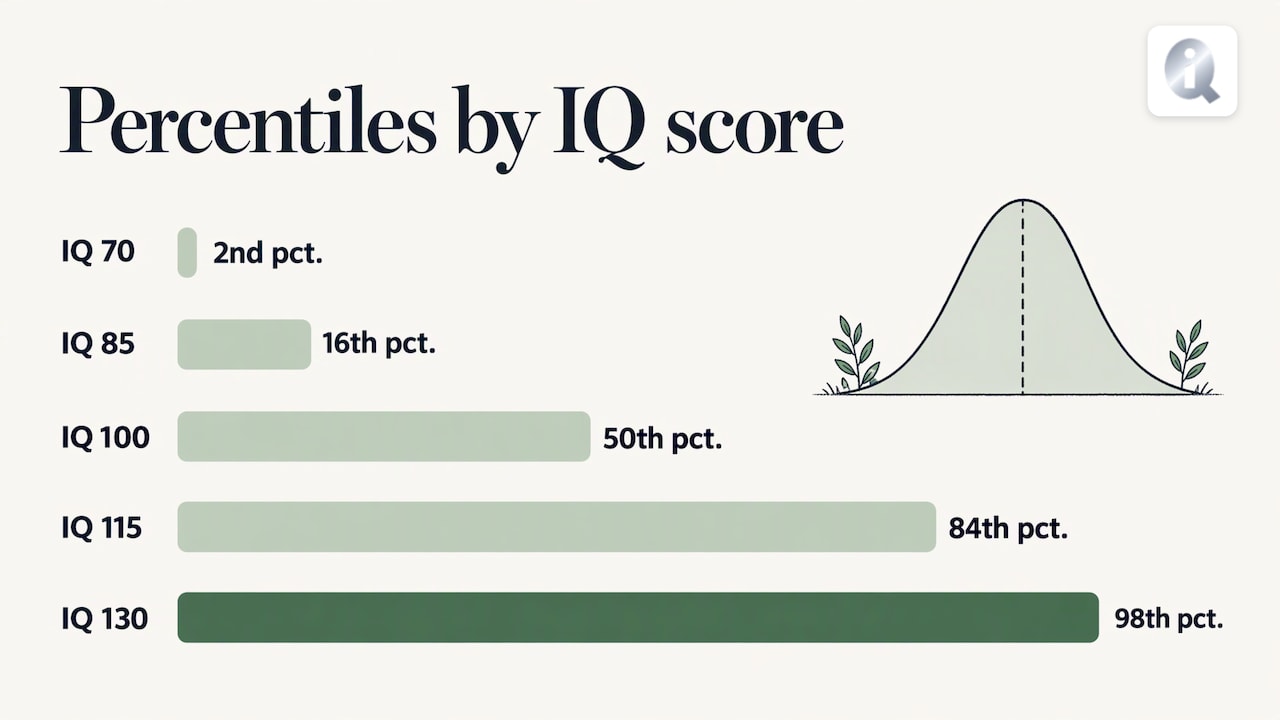
A percentile tells you the percentage of the norm group scoring at or below your result. The relationship between IQ points and percentiles is nonlinear: near the center of the curve a few points move you across many percentile ranks, while at the tails the same points move you very little (How Intelligence Works).
The table below uses the approximate percentiles reported by HowStuffWorks for the conventional mean-100, SD-15 model, with intermediate values we derive from the same normal-curve model.
| IQ score | Distance from mean | Approximate percentile |
|---|---|---|
| 70 | −2 SD | 2nd |
| 85 | −1 SD | 16th |
| 100 | 0 SD | 50th |
| 115 | +1 SD | 84th |
| 120 | +1.33 SD | 91st |
| 125 | +1.67 SD | About top 5% |
| 130 | +2 SD | 98th |
The 16th and 84th percentile values follow directly from the 68% rule: the remaining 32% splits evenly between the two tails. To convert any score yourself, use our IQ percentile calculator, or explore the shape of the curve with the IQ standard deviation calculator. For the full distribution background, see our article on IQ score distribution.
IQ classification ranges
Psychologists often attach descriptive labels to score bands. HowStuffWorks presents a common framework, and notes that labels vary by test and edition:
| IQ range | Common label |
|---|---|
| 130 and above | Very high or extremely high |
| 120 to 129 | Very high or superior |
| 110 to 119 | High average |
| 90 to 109 | Average |
| 80 to 89 | Low average |
| 70 to 79 | Very low |
| Below 70 | Extremely low |
OpenStax likewise describes 130 or above as a superior level on the scale it presents. Treat these as shorthand for percentile bands, not as verdicts. A “high average” label and an “average” label are separated by one point at the boundary, yet the people on either side of that line are practically indistinguishable in test performance.
For a practical discussion of what counts as a good score, see what is a good IQ score.
What specific scores mean
Readers often ask about particular numbers. The principle is the same for each: find the score on the curve, then consider the error band.
What does a 94 IQ mean?
A score of 94 falls inside the 85 to 115 average range described by OpenStax. It lies slightly below the mean of 100, at roughly the 34th percentile on the normal model (z = −0.4). About a third of the norm group would score at or below it, and about two thirds above it. Under the labeling scheme above it is in the average band.
What does a 110 IQ mean?
A score of 110 is also within the 85 to 115 range, and sits at about the 75th percentile (z ≈ 0.67). It is the lower edge of the “high average” band in the framework above. A person with a 94 and a person with a 110 differ by 16 points, a little more than one standard deviation, which is a real difference in standing but one that sits fully inside what is considered the typical range.
What does a score below 70 mean?
A score under about 70 is not, by itself, a diagnosis of intellectual disability. OpenStax states that a diagnosis also requires major deficits in adaptive functioning and onset before age 18. If you or a family member has concerns, a licensed clinical or school psychologist is the professional who can administer an individual test and evaluate adaptive functioning.
What does a score of 130 or above mean?
IQ 130 is two standard deviations above the mean, the 98th percentile on the conventional model. The scale becomes less precise at the extremes, because few people in the norm sample score there, so very high numbers deserve especially wide error bands.
Margin of error: why a score is a range
No test measures perfectly. The standard error of measurement (SEM) quantifies the imprecision and lets clinicians compute a confidence interval around the obtained score (Mezure Clinical Manual). The Stanford-Binet 5 report format, for example, includes a 90% confidence interval around the Full Scale IQ and other composites (scoring guide).
Polytechnique Insights argues that results should be accompanied by a confidence interval, such as approximately plus or minus five points, and that administration conditions and the examiner’s interpretation are part of what a result means (Polytechnique Insights).
Applied to a score of 108 with a band of plus or minus 5, the interpretation is “likely between 103 and 113”, which spans roughly the 58th to the 81st percentile. That is a more honest statement than “108 exactly”, and it also explains why retesting can return a different number without anything having changed.
Factors that widen the practical error include:
- Test conditions: fatigue, noise, illness, and time pressure.
- Different tests: each has its own norm sample, item types and edition, so two tests may give different scores for the same person.
- Norm age: scores are always compared with people your own age, so the comparison group changes as you age.
Overall score versus index scores
The full-scale number compresses several abilities into one figure. Clinical batteries report more. The WISC-V, for example, gives a Full Scale IQ plus five indices: Verbal Comprehension, Visual Spatial, Fluid Reasoning, Working Memory and Processing Speed (OpenStax). The APA also notes that IQ tests can yield verbal and performance scores and additional indices such as processing speed and verbal comprehension.
This matters for interpretation. Two people with the same overall 105 may have very different profiles: one balanced across all domains, another strong in reasoning and slower in processing speed. The second profile suggests different study habits, work environments and tasks than the first. When a report offers domain scores, read them before drawing conclusions from the headline number.
What an IQ score cannot tell you
A score does not measure motivation, creativity, social skill, knowledge in a specific field, or character. It is a measure of performance on a set of cognitive tasks, compared with a norm group, at one moment. It does not rank people as individuals in worth, and it does not predict a single life outcome with certainty.
It also says nothing about personality, which influences how people work, collaborate and persist. That is why we treat cognitive results and personality results as separate, complementary pieces of information.
Interpreting results from online tests
Online assessments differ in design, norming and conditions, so a result should be read as an informed estimate, not as a clinical finding. Unsupervised conditions, differing devices and no examiner mean that the margin of error is likely larger than in individually administered clinical tests. A clinical evaluation, such as one a school or licensed psychologist conducts, is the route for diagnostic questions, educational placement or disability documentation.
Our own assessment is a 50-question test covering five cognitive domains. You can take it without creating an account and you first see a broad result category. If you want more detail, you can unlock the exact score, percentile context, five-domain breakdown and personalized report. We design the report to be read the way this article describes: as a score with context, not as a label.
Our perspective
We read an IQ score the way a statistician reads any standardized measure: as a position on a distribution, with an error band around it. The most common mistake we see is treating a single integer as a verdict. A 112 and a 108 are not meaningfully different, and no number defines a person.
That is why our assessment is built around context. A broad category comes first and is free, with no account. If you want precision, the paid result adds the exact score, percentile context and a five-domain breakdown, because the domain profile is usually the most actionable part. It costs $9.99 once per completed result, and it is not a subscription.
We also encourage readers to pair cognitive results with personality results and with career interests. Strengths are easier to use when you can see how they fit the work you want to do.
Steve
See your own score in context
If you want to move from theory to your own profile, our 50-question IQ assessment starts with no account and gives you a broad result category. The Full IQ Result, $9.99 once per completed result, unlocks your exact IQ score, percentile context, five-domain breakdown, a personalized report, a verifiable certificate and Career Matches. Review the Full IQ Result on our pricing page.
For work style, the separate Big Five personality assessment gives OCEAN trait percentiles and an archetype for free after sign-in, and Personality Full Access at $14.99 once per result adds a detailed profile, workplace-fit insights and a verifiable certificate. If you only want to check a number you already have, the free IQ tools convert scores and percentiles at no cost. You can also see what a given number means in our IQ score meaning tool, or place yourself among professions and countries with the IQ comparison tool.
A short checklist for reading any score
- Identify the test and its scale. Most use a mean of 100 and an SD of 15, but confirm it.
- Convert the score to a percentile.
- Apply a confidence interval of about plus or minus five points unless the report states its own.
- Look at the index or domain scores, not only the total.
- Check the labels against the percentile bands, since labels differ between tests.
- For decisions about education, diagnosis or accommodation, consult a licensed psychologist.
FAQ
What does IQ stand for, and what does the quotient mean?
IQ stands for intelligence quotient. The term originally came from dividing mental age by chronological age and multiplying by 100. Modern tests instead compare your performance with a norm group and place it on a scale with a mean of 100 and a standard deviation of 15.
Is an IQ of 100 good or bad?
It is neither. An IQ of 100 is the center of the scale, the 50th percentile, and it falls inside the 90 to 109 band commonly labeled average. Our guide to the US average IQ explains why 100 is a norm rather than a national measurement.
How accurate is an IQ score?
Every IQ score is an estimate with measurement error. A common way to express it is a confidence interval of roughly plus or minus five points, so a reported 110 is better read as a range of about 105 to 115. Conditions at the time of testing also affect the result.
Is an IQ below 70 a diagnosis?
No. According to OpenStax, a diagnosis of intellectual disability also requires major deficits in adaptive functioning and onset before age 18. A licensed clinical or school psychologist can evaluate this properly.
Sources
- APA Dictionary of Psychology: IQ
- Nova Southeastern University: Intelligence Testing
- OpenStax Psychology 2e: Measures of Intelligence
- HowStuffWorks: IQ Scale Explained
- How Intelligence Works: What Is IQ
- Stanford-Binet 5 Online Scoring and Report System User’s Guide
- Psychology Stack Exchange: calculating IQ from raw scores
- Mezure Clinical Manual
- Polytechnique Insights: IQ, can intelligence really be measured?