IQ Score Distribution: Bell Curve, Standard Deviation and Percentiles

IQ scores follow an approximately normal (bell-shaped) distribution with a mean of 100 and, on most modern tests, a standard deviation of 15 points. In practice this means that about 68% of people score between 85 and 115, about 95% score between 70 and 130, and only about 2% score 130 or higher. The rest of this article shows where those figures come from, how to convert a score into a percentile, and where the bell curve model stops being a reliable guide.
TL;DR
- IQ tests are scaled so that scores have a mean of 100 and a standard deviation of 15 (OpenStax Psychology 2e). The distribution is symmetric around 100.
- Under the normal model, roughly 68% of people fall within one standard deviation (85 to 115), 95% within two (70 to 130), and 99.7% within three (55 to 145).
- A percentile is a rank, not a quantity: the gap between the 50th and 60th percentiles is much smaller in IQ points than the gap between the 90th and 99th.
- Variance is the square of the standard deviation (15 squared is 225). It is a statistical quantity and is rarely reported on score reports.
- Norms drift over time (the Flynn effect), so a score is only meaningful relative to the norm group and the test edition that produced it.
Table of Contents
- What the IQ distribution is
- Why the bell curve takes this shape
- IQ standard deviation: the number that sets the spread
- IQ variance: how it relates to the standard deviation
- How many people score in each range
- IQ percentile chart
- IQ points are not percentages
- Where the normal model falls short
- The Flynn effect and why norms are updated
- Perspective: how we read the distribution
- See where your own score falls
- FAQ
- Sources
What the IQ distribution is
An IQ score is not a count of correct answers. Test publishers collect results from a large, representative norm group, and then transform raw scores so that the norm group has a fixed mean and spread. The older ratio method (mental age divided by chronological age) has mostly been replaced by the deviation IQ, which is computed from how far an individual’s score sits from the mean of the norm group, according to the APA Dictionary of Psychology.
This design is the reason the distribution looks the way it does. Because the scale is set by the norm group, the average score is 100 by construction, and the spread is 15 by construction. What the data contribute is the shape: raw results on well-built cognitive tests cluster near the middle and thin out symmetrically toward both extremes, which is what OpenStax describes as a bell curve showing a normal distribution of intelligence in the population.
Two points of vocabulary matter for the rest of this article:
- Mean: the arithmetic average of the norm group, fixed at 100.
- Standard deviation (SD): the typical distance of a score from the mean. On Wechsler-style scales it is 15. Some older or alternative scales use a different SD (for example 16 on the historical Stanford-Binet), which is why a score from one test cannot be read against another test’s table without conversion. Our IQ score converter handles that translation.
Why the bell curve takes this shape
The normal distribution appears whenever a measurement is the sum of many small, largely independent influences. The central limit theorem, in its textbook form, says that sums and averages of many independent contributions tend toward a bell shape as the number of contributions grows. This is the standard statistical explanation offered in introductory courses for why a large sample of adult IQ scores produces a bell-shaped histogram (Pearson, Elementary Statistics).
A test with dozens of items spanning several cognitive domains behaves in a similar way: each item adds a small piece of information, and the total score reflects many pieces. Test developers also have a practical hand in the shape. When they convert raw scores to the IQ scale, they typically normalize the conversion so the reported scores follow the bell curve. The curve is therefore both an empirical regularity and a design target.
The practical consequence is that the model is most trustworthy in the middle of the range and least trustworthy in the tails. We return to that limitation below.
IQ standard deviation: the number that sets the spread
The standard deviation determines how wide the bell is. With a mean of 100 and an SD of 15:
- One SD above the mean is 115; one SD below is 85.
- Two SDs span 70 to 130.
- Three SDs span 55 to 145.
OpenStax states that scores between 85 and 115 are considered average and include 68% of the population, and that the SD is set at 15 in modern IQ testing (OpenStax). The 68-95-99.7 rule gives the same pattern for any normal distribution: about 68.3% of observations within one SD, 95.4% within two and 99.7% within three.
The SD also tells you how to express any score in standardized form. The z-score is the score minus 100, divided by 15. A score of 130 is z = +2.0; a score of 85 is z = -1.0; a score of 107.5 is z = +0.5. Once you have the z-score, the percentile follows from the normal curve. If you prefer not to look up tables, our IQ standard deviation calculator draws the bell curve and marks where a given score sits.
Why the SD is not always 15
The value of 15 is a convention that most major current tests share. It is not a law of nature, and a reader comparing numbers across sources should check the SD before comparing scores. A score of 132 on a scale with an SD of 16 is exactly 2 SDs above the mean, the same standing as 130 on an SD-15 scale. The difference is small near the middle and grows in the tails, which is one reason published claims about very high scores are hard to compare.
IQ variance: how it relates to the standard deviation
Variance is the average of the squared deviations from the mean, and the standard deviation is its square root (Wikipedia, Variance). For IQ scales with an SD of 15, the variance is 15 x 15 = 225 squared IQ points. For a scale with an SD of 16, it is 256.
Two practical notes follow:
- Units. Variance is expressed in squared units, so “225 IQ points squared” has no everyday interpretation. That is why score reports use the SD, which returns to the original unit of points.
- Where variance is used. Researchers use variance because it can be partitioned: total variance in test scores can be divided into components (for example, variance between groups and variance within groups, or variance attributable to measurement error). When a study reports that a factor “explains 10% of the variance” in IQ, it means that factor accounts for one tenth of the 225 squared points of spread, not 10% of anyone’s score.
If you see an IQ variance figure that is not 225 (or 256), the source is almost certainly describing a sample rather than the norm group. Samples drawn from a narrow population, such as students at a selective university, usually have a smaller variance than the general population because the range has been restricted.
How many people score in each range
The table below applies the normal model with mean 100 and SD 15. The percentages come from the standard normal curve and are rounded to one decimal place; real populations deviate slightly, especially in the tails.
| IQ range | Distance from mean | Approx. share of population |
|---|---|---|
| Below 70 | More than 2 SD below | 2.3% |
| 70 to 84 | 1 to 2 SD below | 13.6% |
| 85 to 115 | Within 1 SD | 68.3% |
| 116 to 130 | 1 to 2 SD above | 13.6% |
| Above 130 | More than 2 SD above | 2.3% |
These figures line up with the checked reference values: OpenStax reports about 68% in the 85 to 115 band, about 2% at 130 or higher, and 2.2% below 70 (OpenStax). The small differences (2.2% versus 2.3%) come from rounding and from whether the cutoff is placed at 70 or 69.5.
Reading the bands
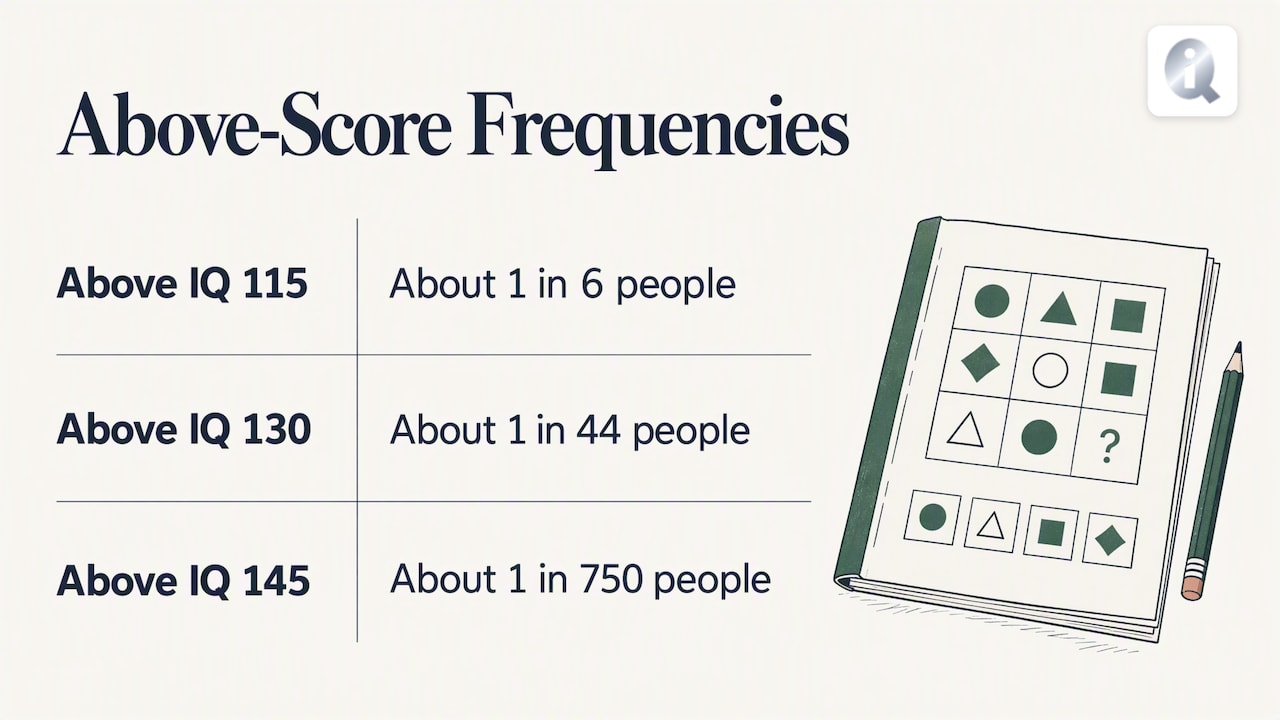
Labels such as “average”, “high average” or “superior” differ between publishers, so treat any band name as a convention of one test manual. What does not change between sources is the arithmetic. Roughly 1 person in 6 scores above 115, about 1 in 44 scores above 130, and about 1 in 750 scores above 145 under the normal model. For a fuller discussion of what counts as a good score and how to interpret each range, see our guide to what a good IQ score is.
IQ percentile chart
A percentile rank is the percentage of the norm group that scored below a given score. The table converts common IQ scores into percentiles using the normal model (rounded).
| IQ score | z-score | Percentile | Meaning |
|---|---|---|---|
| 70 | -2.00 | 2nd | About 2% of people score lower |
| 80 | -1.33 | 9th | |
| 85 | -1.00 | 16th | |
| 90 | -0.67 | 25th | |
| 100 | 0.00 | 50th | The median and the mean coincide |
| 110 | +0.67 | 75th | |
| 115 | +1.00 | 84th | |
| 120 | +1.33 | 91st | |
| 125 | +1.67 | 95th | Roughly the top 5% |
| 130 | +2.00 | 98th | |
| 140 | +2.67 | 99.6th | |
| 145 | +3.00 | 99.9th |
The 125 row answers a frequent question: a top 5% IQ is a score of about 125 on an SD-15 scale. A score of 93 sits at roughly the 32nd percentile, which is within the average band (85 to 115) and well above the cutoff for any concern.
The percentile table also shows why percentiles need careful reading. Between 90 and 110, the percentile climbs from 25 to 75, a 50-point swing in just 20 IQ points. Between 130 and 150, it climbs from 98 to above 99.9. Percentiles are ordinal ranks, so the distances between them are unequal (University of Delaware handout on norm-referenced score interpretation). Moving from the 50th to the 60th percentile takes about 4 IQ points; moving from the 90th to the 99th takes about 14.
To look up your own score without a table, use the IQ percentile calculator, and for a plain-language reading of any number see IQ score meaning.
IQ points are not percentages
A common misreading treats an IQ of 100 as “100%” of something, or an IQ of 50 as half the ability of someone at 100. Neither is correct. IQ scales are ordinal in the sense that they represent rank order and do not imply that mental ability is linearly related to the number (Wikipedia, Intelligence quotient), and IQ points are not percentage points. The same logic applies to other norm-referenced exams: a standardized score tells you where someone stands relative to a reference group, not how much of a fixed quantity they have. Standardized testing in college admissions is read in a comparable way, with scores interpreted against the distribution of other test takers.
Where the normal model falls short
The bell curve is a useful approximation, and it has limits worth stating plainly.
Measurement error. Any single score is an estimate. Test manuals report a standard error of measurement and confidence intervals, which means a reported 110 is better described as a range around 110 than as a point. Differences of a few points between two scores, or between two tests, are frequently within error.
The tails. Few people are tested at the extremes, so norm tables there rest on small samples and on extrapolation. Statements such as “1 in a million” for a given score are model outputs, not counted frequencies.
Different tests, different results. Tests sample different tasks and use different norm groups. Some tests yield more specific indices, such as verbal and performance IQ, and discrepancies between them can be used diagnostically to identify learning disabilities or cognitive deficits (APA Dictionary of Psychology). A single composite can therefore hide a spread profile. This is why our assessment reports a five-domain breakdown in addition to the overall figure.
Interpretation versus reliability. Critics of IQ scales mostly raise questions about how scores are interpreted and about cultural and social assumptions in testing, rather than about the reliability of the scores themselves, a distinction the APA dictionary draws. A statistically well-behaved score is not automatically a complete description of a person.
The Flynn effect and why norms are updated
Average raw performance on intelligence tests has risen over the twentieth century. The Flynn effect describes worldwide increases of about three IQ points every 10 years, which makes regular re-standardization of tests necessary (Ramoo, via Introduction to Psychology). If norms were never refreshed, the average would drift above 100 and the distribution would be centered on the wrong value.
For the reader, the consequences are concrete:
- A score from an old test edition is generally higher than the same person would earn on a current edition.
- The mean of 100 describes the norm group of a particular test, not a permanent national or global average. Our article on the US average IQ explains why 100 is a norm and not a measured national score.
- Any institution that uses cognitive scores must track which edition and which norms it is applying. The same concern is discussed in psychometric testing in recruitment, where valid comparisons depend on up-to-date norm groups.
Perspective: how we read the distribution
We build percentile and standard deviation tools, so we see the same misunderstanding repeatedly: readers treat the number as the finding. The distribution tells a different story. The finding is the position of a score within a reference group, and the precision of that position depends on the test, the norm group and the measurement error.
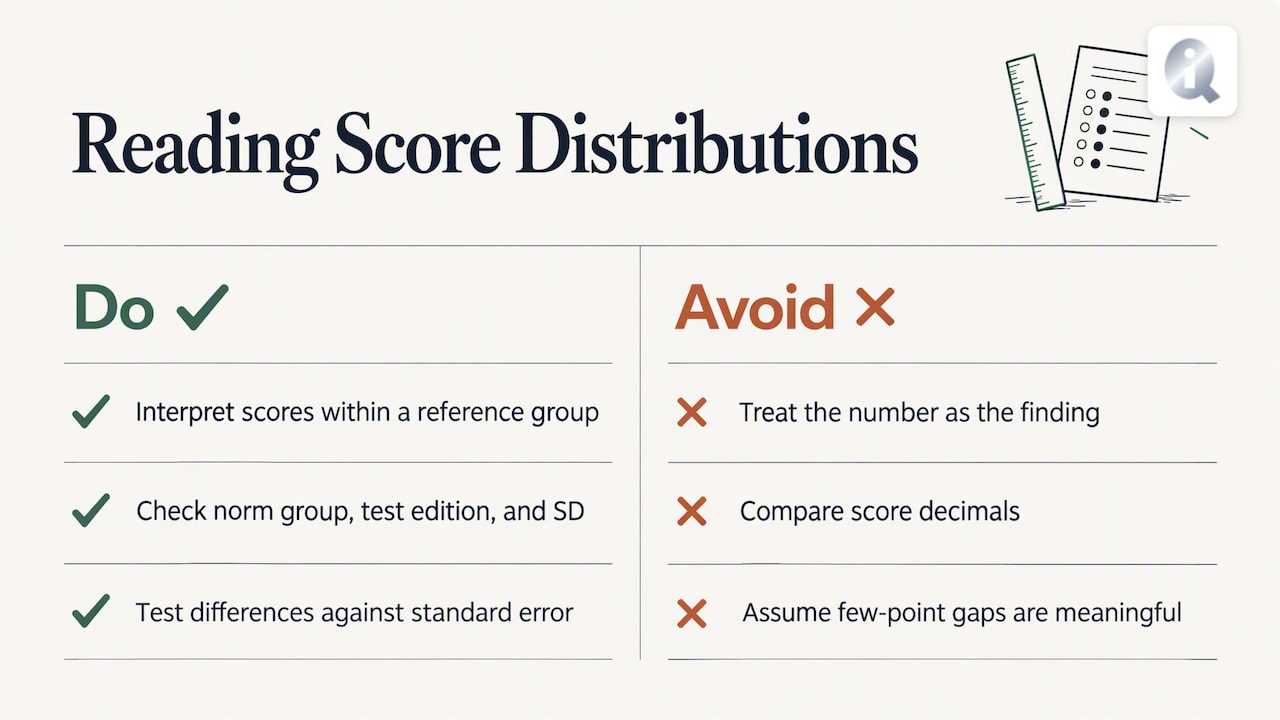
Our approach follows from that. Our free 50-question assessment returns a broad result category first, because a broad category is what the evidence supports for a short online instrument. The exact score, percentile context and five-domain breakdown are an optional unlock, not the headline. We would rather a reader understand that a result of 112 and a result of 116 are statistically hard to separate than that they compare decimals.
We also recommend using the distribution to check claims. If a source says a group averages far above 100, ask which norm group, which test edition and which SD. If a headline compares two countries or two professions by a few points, ask whether the difference exceeds the standard error. Tables of percentiles are a way to test every such claim in under a minute. Our IQ comparison tool and profession rankings are built to be read with this caution.
— Steve
See where your own score falls
If you want your own position on the curve, you can take our 50-question IQ assessment without creating an account and receive a broad result category for free. Unlocking the full result costs $9.99 once per completed result, with no subscription, and adds your exact IQ score, percentile context, five-domain breakdown, a personalized report, a verifiable certificate and Career Matches. Details are on the pricing page.

If you are mainly interested in your cognitive strengths rather than a single number, the free cognitive strength finder is a quick starting point, and the full list of calculators is in our free IQ tools.
FAQ
Are IQ scores normally distributed?
Approximately, yes. IQ test results follow a bell curve, which OpenStax describes as a normal distribution of intelligence in the population. The fit is best near the mean and weaker in the extreme tails, where samples are small and test makers rely on statistical models.
What is the standard deviation of IQ?
On most modern tests it is 15 points around a mean of 100. That puts 68% of people between 85 and 115. Some older scales use 16, so check which scale produced a score before comparing it to a table.
What is a top 5% IQ?
On an SD-15 scale, a score of about 125 is at the 95th percentile, so roughly 5% of people score higher. A score of 130 is at about the 98th percentile, which is the usual threshold for the top 2%.
Is a 93 IQ low?
No. A score of 93 is inside the 85 to 115 band that covers roughly 68% of the population, and it sits near the 32nd percentile. Given measurement error of several points, it is statistically indistinguishable from a score of 100 on a different day or test.
What is the Flynn effect?
It is the long-run rise in raw intelligence test performance, about three IQ points per decade on average, according to Ramoo’s overview. Test publishers respond by re-standardizing norms so that the mean stays at 100.
Sources
- 7.5 Measures of Intelligence, Psychology 2e (OpenStax)
- APA Dictionary of Psychology: IQ
- Handout for norm-referenced test score interpretation (University of Delaware)
- Defining and Measuring Intelligence, Introduction to Psychology
- IQ scores of adults are normally distributed (Pearson, Elementary Statistics)
- Intelligence quotient (Wikipedia)
- Variance (Wikipedia)